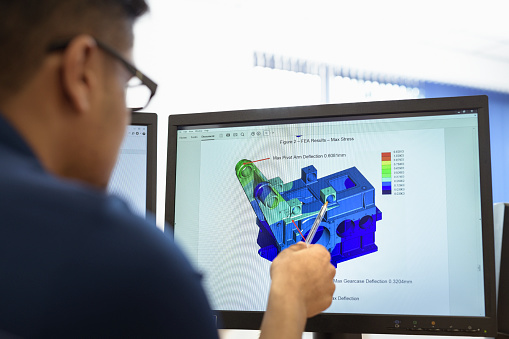

Chain analysis is used to determine the static and dynamic contributions of individual components and subassemblies for complex assemblies such as machine tools in a simulated and automated manner.
Historically, chain analysis arose from a practical problem: If only whole assemblies are simulated, then the static and dynamic deformations result from a complex interaction of coupled effects that influence each other.
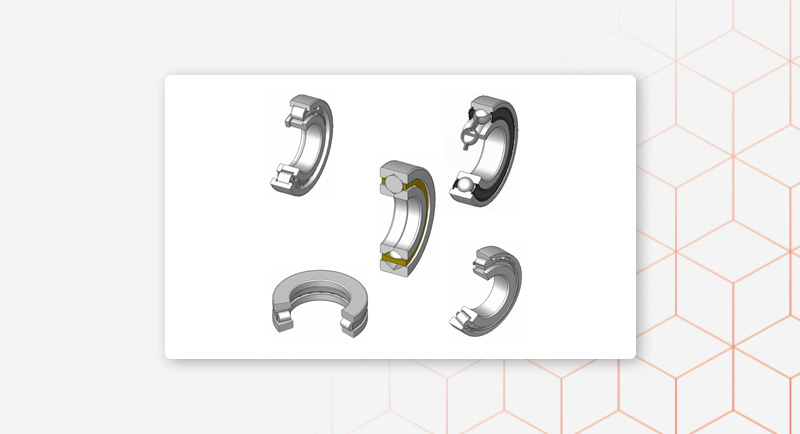
Take a grinding spindle, for example. This can be thought of as a thick shaft that is usually supported on both sides by rolling bearings with low friction and high precision. We observe a relevant bending vibration in the grinding spindles. Now this bending vibration could be improved in two ways: Either the shaft becomes more rigid and/or lighter, or the bearing becomes more torsionally rigid. This is an either/or result. So it is enough to implement one of the two measures to achieve a significant improvement.
Let's take a second example from a driving stand. This can be thought of as a tower-like welded sheet metal structure that can roll in one direction on four guide carriages, the whole driven by a ball screw. We note that the moving column performs a tilting oscillation in which both the guides and the ball screw play an important role. In this case, it is not enough just to make the ball screw stiffer. Nor is it enough just to install stiffer/larger guides. The two elements are interlinked and must be improved at the same time to have a significant impact on the overall result.
Now, in a complex assembly, you have many components and the number of possible "set screws" is correspondingly high. So the question is which set screws are most important.
In the past, we have tried to answer this basic question based on simulation results of the entire assembly. This approach is relatively time-consuming and prone to interpretation. It is not easy to separate, for example, relevant vibrations from unimportant vibrations. Often a harmless sheet metal vibration overlays an important spindle vibration. In addition, the chain of causes for a specific vibration cannot be seen. And finally, it is not possible to say how much a vibration changes when a special design change is made without simulating the complete assembly again after the change. So this is too much like a trial-and-error approach, although fortunately it is no longer experimental but simulative.
Over time, the desire for a standardized and automated evaluation method became louder and louder. The solution was brought about by the so-called chain analysis. Chain analysis is very similar to assembling the assembly. You start at one end of the assembly and assemble the very first component or unit first. Then the next logical units are added step by step until you have assembled the complete assembly. After each step, a complete simulation and analysis is performed. So, not one simulation is performed, but typically 12 stages of assembly are simulated. Finally, the deformations of each stage are compared and the differences are formed. In this way, a precise and, above all, quantitative statement about the influencing factors is obtained at the end.
Intelligent automatisms allow all stages to be simulated and evaluated with little effort (no more than a single simulation).
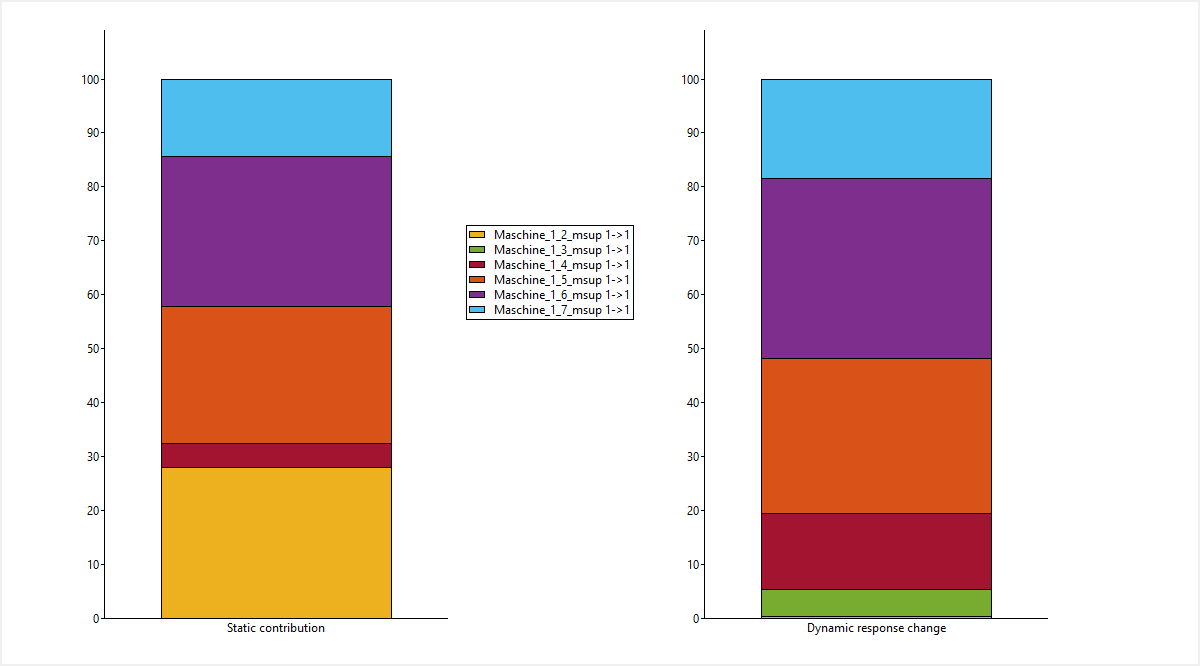
All selected stages can be calculated at once and also the creation of bar charts of the influencing factors is possible automatically.
Usually, both the static and dynamic compliance of an assembly is of interest. And often, the two goals oppose each other. So it may well happen that an improvement in static stiffness leads to a deterioration in dynamic stiffness. So we have to evaluate and keep an eye on both quantities.
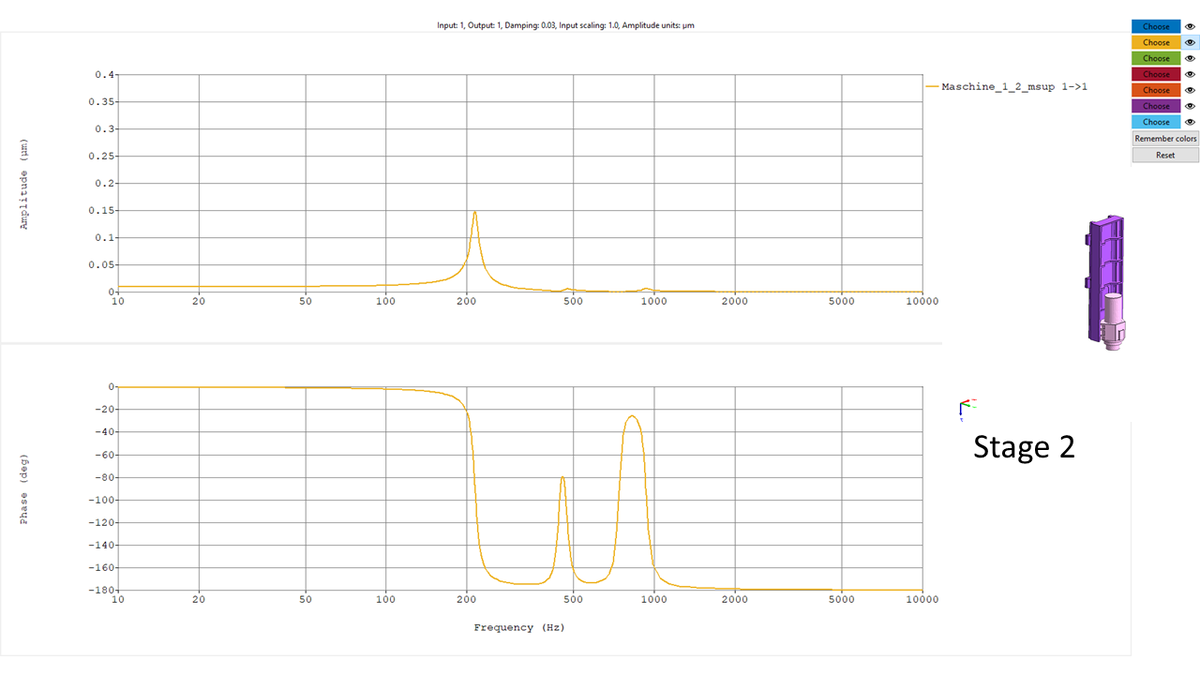
Instead of us running two simulations (one static and one dynamic), we can reduce the effort significantly by running only one dynamic simulation, because the static compliance is already included in the dynamic one. One can see the static compliance as a dynamic compliance but at low frequencies. Specifically, we calculate compliance frequency responses and automatically extract the static and dynamic components from them.
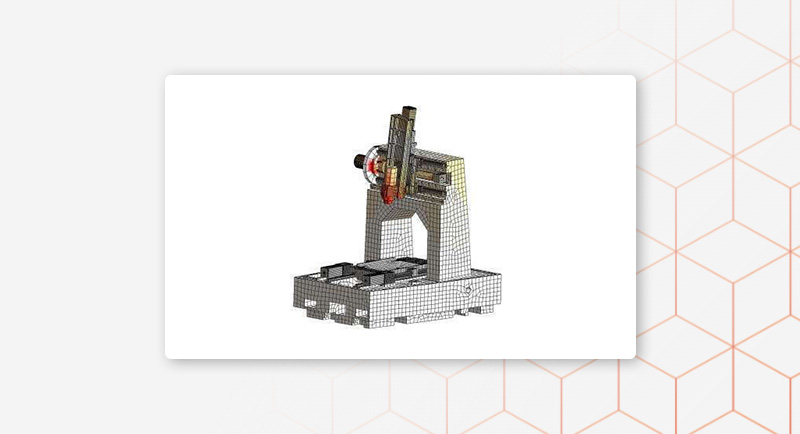
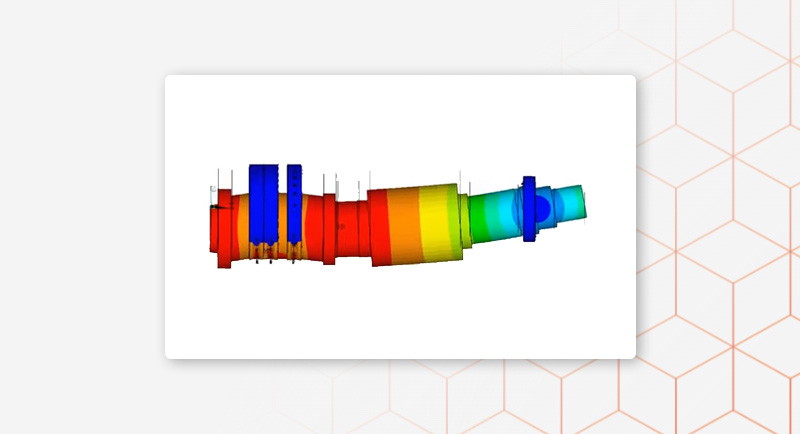
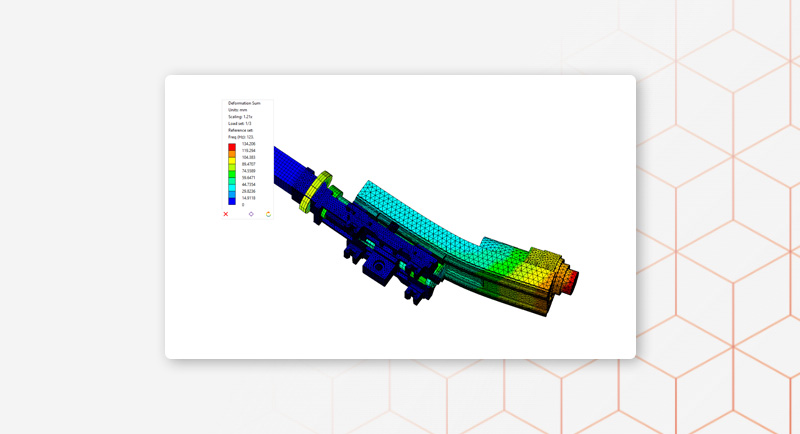
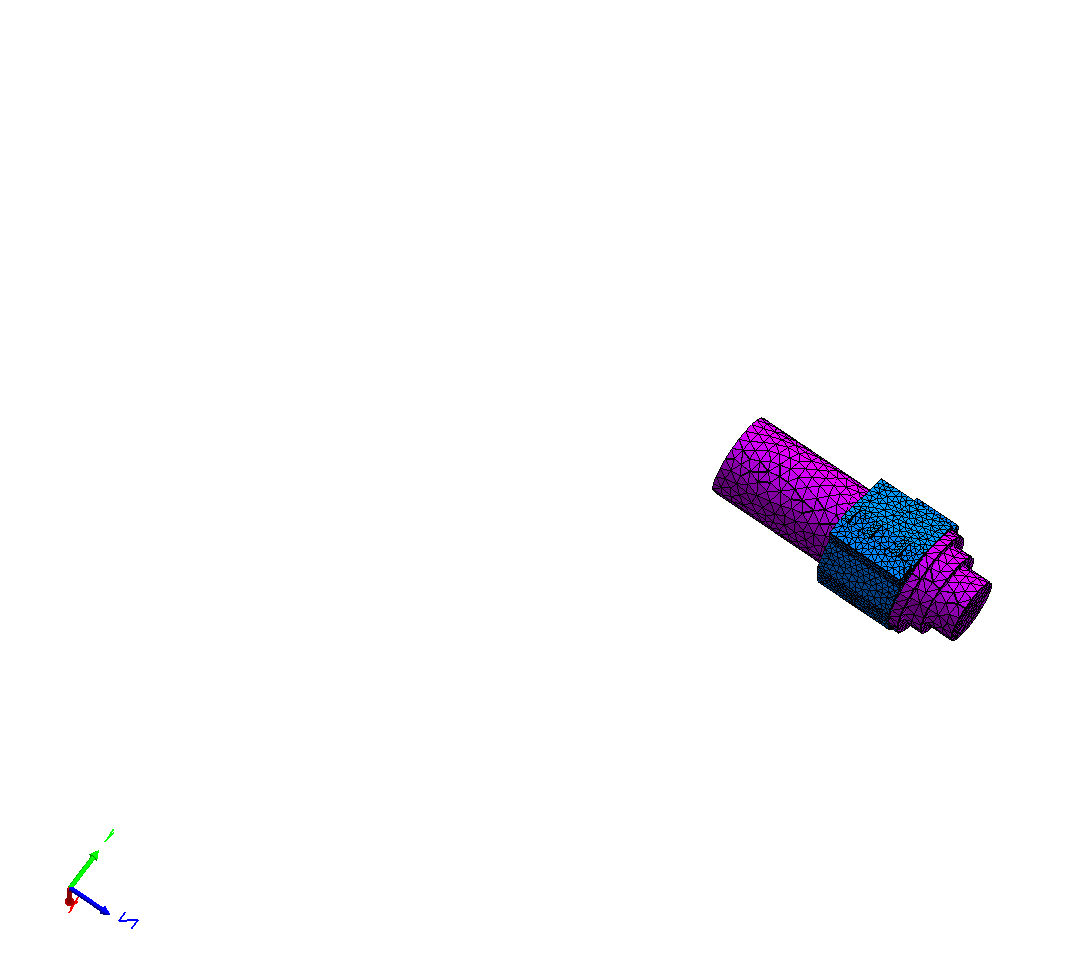
In the following animations, the different stages of a machine tool can be seen. In addition, you can follow in the compliance frequency responses in which way and especially how much individual resonances shift over the individual stages. The largest influences can easily be seen with the naked eye. The final bar graph can be seen as a kind of fingerprint of the machine. If all individual ranges were of equal length, then the design would be optimal. In practice, however, the optimum can never be achieved 100%. The greater the differences between the individual bars, the further the machine is from the optimum.
Stages of a machine tool:
Change of resonances over the stages
Bar chart as a fingerprint of the machine